Moneyball: Why Your AQH Increased, But Its Share Went Down
 We’re turning the keyboard over to NuVoodoo marketing guru Mike O’Connor this week:
NuVoodoo has dedicated the back half of 2023 to the Fall of Moneyball for Radio, sharing lots of little ways to help you grow your station ratings by a tenth of a point. It can make a big difference in station revenue. Now that report cards are rolling in, we thought it timely to share a more sophisticated way of evaluating the results of your collective team’s efforts to increase ratings. It’s not as simple as comparing your station share to those of your primary competitors. Not if the goal is to move the sales needle materially.
So, we reached out to our nearly decade-long partner, Mark Shannon O’Neill, who specializes in helping radio stations maximize their ratings and revenue. Under the aegis of ROI Media Solutions, Mark has developed a series of proprietary online tools & reports that keep clients focused on the key metrics that can quickly and most efficiently convert to revenue. Mark has also devised a proprietary micro-targeting capability in tandem with NuVoodoo’s marketing team, and he is often involved with NuVoodoo’s post-campaign analysis for clients. With the December survey period nearing completion, we recently sat down with Mark so we could share with you how we determine whether a marketing or promotional campaign designed to boost ratings was successful.
Mark, now that we have some early Fall ratings results in the can for NuVoodoo clients, let’s walk through that process.
The first thing that I look to understand when the book comes out is the PUMM Trend.
On the chart below, PUMM reflects the total amount of listening to media (in this case, radio) for a particular demo/daypart/geography.
Right. There are three trends that I specifically track: The longer-term, pre-COVID trendline, the post-COVID recovery line, and the trend for the last six months.
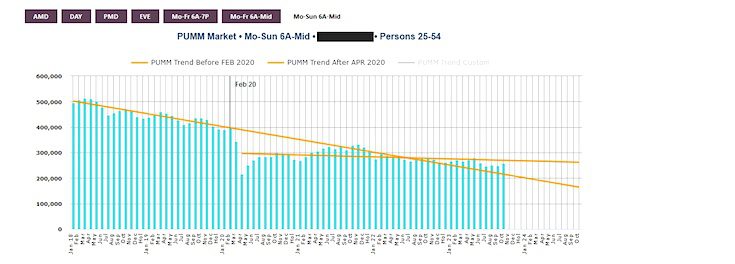 From the long-term trend line, I want to understand where the market stands relative to where it likely would have been had the pre-COVID trend continued. The post-COVID trend line shows the general direction of PUMM since APR20.
So, the area between the extrapolated lines is likely where PUMM will end up in the coming year?
Yes. But, the six-month trend, added to the chart in purple below, allows you to more reliably guess where PUMM is likely to be in the coming year. That number will be the driving factor for ALL ratings and financial projections for the year ahead.
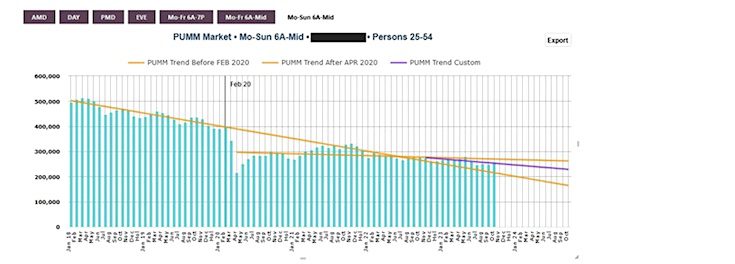
So we’re clear. In the Market X chart above, as of January 2018, PUMM reflected an average of half a million 25 – 54 year-olds listening to radio in any given quarter hour across the week. By October of 2024, PUMM declined to roughly 275,000 adult listeners for the same measured period.
Correct. PUMM is the total available radio audience, which in turn, becomes the basis for market and station revenue. PUMM is the numerator for the total market average quarter-hour rating, which is expressed as a percentage of the market population. PUMM is the denominator for station SHARE, which is expressed as a percentage of total market listening for a given demo/daypart.
You also want to note if the pre-COVID seasonal trend patterns have returned. As PUMM goes up seasonally, you expect the stations to rise with the tide. As PUMM declines seasonally, the station AQH is likely to decrease with the lower tide. All of those should be viewed in the context of the longer-term trend which is exerting downward pressure on station AQH – seasonal highs are lower, seasonal lows are lower.
So, a station could experience a rise in the ratings, and the programmer could mistakenly attribute that result to whatever promotion or marketing efforts were made when, in reality, the increase is simply the byproduct of a proportional uptick in overall radio listening.
Yes. In fact, It is also possible to see the monthly AQH increase only to see a decrease in SHARE or RANK. That scenario happens when the station AQH increases but not at the same rate as PUMM.
Of course, the driving consideration in all of this is AQH RATING, not SHARE. That’s the KPI that matters most when we work with you on developing a targeting strategy or later when measuring the impact of a NuVoodoo client campaign.
Absolutely. The RATING is what drives revenue. If a station increases a tenth of a rating point in a key Sales Daypart, the station will see an increase in Average Unit Rate. If a station increases a tenth of a rating point in a broad daypart, the station will see dramatic increases in their Miller Kaplan results.
The goal of a marketing campaign is to either increase the AQH to the next tenth of a RATING point or to prevent the loss of a tenth.
Let’s use these next two charts, which reflect actual past NuVoodoo – ROIMS campaign partnerships, to show how to track and evaluate a successful marketing campaign.
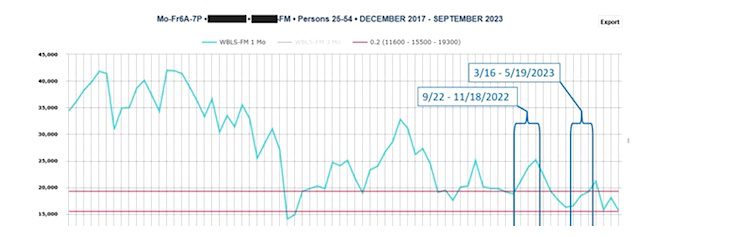
In AUG22, the station fell into the 0.2 RATINGS range (The teal-colored line, representing the station’s average quarter-hour audience value, fell below the upper boundary of the AQH range that would deliver a .2 rating, which is outlined in red above). The early Fall campaign was intended to recover the 0.3 RATING and you can see that it successfully did. With the long-term decline in PUMM, the station slowly declined back down into the 0.2 range in subsequent months. So, in the Spring of 2023, the station again invested in a two-month NuVoodoo marketing campaign that got it back into the 0.3 range (above the red upper boundary for a .2 rating).
Since PUMM ebbs and flows seasonally, how do we know if the increases were attributable to the marketing campaign or the seasonal rise in PUMM?
The next chart is a year-over-year look at AQH and PUMM indices. You can see that over time, the station YoY AQH Index generally flowed directionally WITH the YoY PUMM Index.
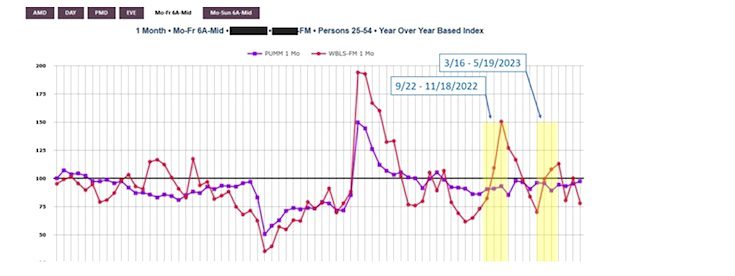
In the case of the two NuVoodoo marketing campaigns, the station YoY AQH Index clearly broke out of the gravitational pull of the declining PUMM while the campaign was in full swing. There was a ‘halo’ period while the station drifted back toward the PUMM trend line. This is known in statistics as a regression or reversion to the mean.
So, the actual definition of success for any tactical investment in a ratings-boosting strategy should be twofold. First, jump the average quarter-hour audience level so that it at least rests in the range of the next tenth of a rating point higher. Second, outperform PUMM?
Yes. In each of the two marketing campaigns, the station AQH reached the threshold to add a tenth of a rating point on the broad daypart. Also, each of the campaigns deviated dramatically from the PUMM trend with exactly the same timing as the marketing. Combined, that defines how to recognize a successful marketing campaign.
Of course, in a world where “flat is the new up,” it may be valuable to prevent the costly loss of a tenth of a rating point. If you track the correlation between the station’s AQH Ratings and the monthly total spot revenue, you will be able to quantify how much revenue was at risk had the station declined a tenth.
NuVoodoo builds digital products, conducts research, and executes marketing campaigns for the broadcast industry, often in partnership with Mark O’Neill and his clients. For a free consultation ahead of the 2024 budget year, contact tellmemore@nuvoodoo.com. We’d love to help!